


Comparing Means in R
Previously, we described the essentials of R programming and provided quick start guides for importing data into R. Additionally, we described how to compute descriptive or summary statistics and correlation analysis using R software.
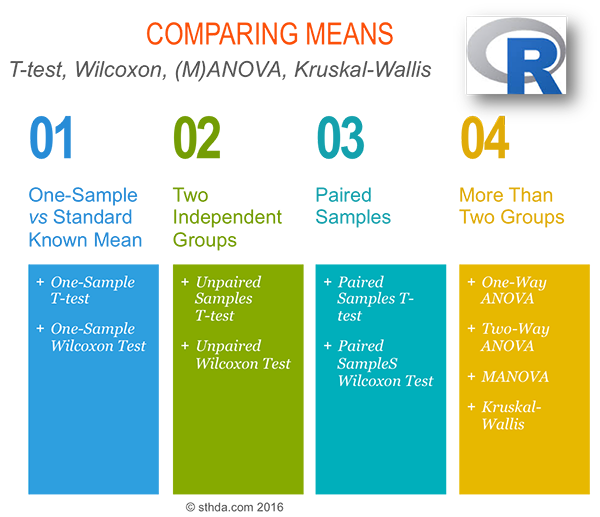
This chapter contains articles describing statistical tests to use for comparing means. These tests include:
- T-test
- Wilcoxon test
- ANOVA test and
- Kruskal-Wallis test
1 How this chapter is organized?
- Comparing one-sample mean to a standard known mean:
- Comparing the means of two independent groups:
- Comparing the means of paired samples:
- Comparing the means of more than two groups
- Analysis of variance (ANOVA, parametric):
- Kruskal-Wallis Test in R (non parametric alternative to one-way ANOVA)
2 Comparing one-sample mean to a standard known mean
2.1 One-sample T-test (parametric)
- What is one-sample t-test?
- Research questions and statistical hypotheses
- Formula of one-sample t-test
- Visualize your data and compute one-sample t-test in R
- R function to compute one-sample t-test
- Visualize your data using box plots
- Preliminary test to check one-sample t-test assumptions
- Compute one-sample t-test
- Interpretation of the result
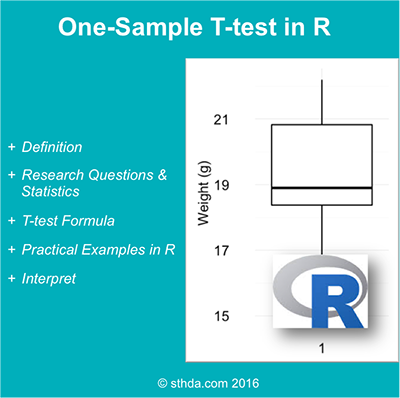
Read more: —> One-Sample T-test.
2.2 One-sample Wilcoxon test (non-parametric)
- What’s one-sample Wilcoxon signed rank test?
- Research questions and statistical hypotheses
- Visualize your data and compute one-sample Wilcoxon test in R
- R function to compute one-sample Wilcoxon test
- Visualize your data using box plots
- Compute one-sample Wilcoxon test
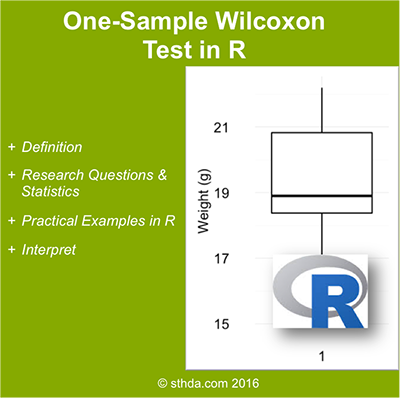
Read more: —> One-Sample Wilcoxon Test (non-parametric).
3 Comparing the means of two independent groups
3.1 Unpaired two samples t-test (parametric)
- What is unpaired two-samples t-test?
- Research questions and statistical hypotheses
- Formula of unpaired two-samples t-test
- Visualize your data and compute unpaired two-samples t-test in R
- R function to compute unpaired two-samples t-test
- Visualize your data using box plots
- Preliminary test to check independent t-test assumptions
- Compute unpaired two-samples t-test
- Interpretation of the result
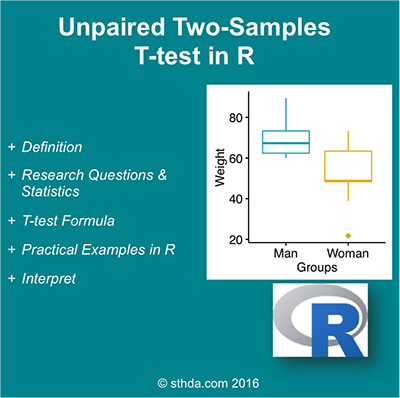
Read more: —> Unpaired Two Samples T-test (parametric).
3.2 Unpaired two-samples Wilcoxon test (non-parametric)
- R function to compute Wilcoxon test
- Visualize your data using box plots
- Compute unpaired two-samples Wilcoxon test
Read more: —> Unpaired Two-Samples Wilcoxon Test (non-parametric).
4 Comparing the means of paired samples
4.2 Paired samples Wilcoxon test (non-parametric)
Read more: —> Paired Samples Wilcoxon Test (non-parametric).
5 Comparing the means of more than two groups
5.1 One-way ANOVA test
An extension of independent two-samples t-test for comparing means in a situation where there are more than two groups.
- What is one-way ANOVA test?
- Assumptions of ANOVA test
- How one-way ANOVA test works?
- Visualize your data and compute one-way ANOVA in R
- Visualize your data
- Compute one-way ANOVA test
- Interpret the result of one-way ANOVA tests
- Multiple pairwise-comparison between the means of groups
- Tukey multiple pairewise-comparisons
- Multiple comparisons using multcomp package
- Pairwise t-test
- Check ANOVA assumptions: test validity?
- Check the homogeneity of variance assumption
- Relaxing the homogeneity of variance assumption
- Check the normality assumption
- Non-parametric alternative to one-way ANOVA test
Read more: —> One-Way ANOVA Test in R.
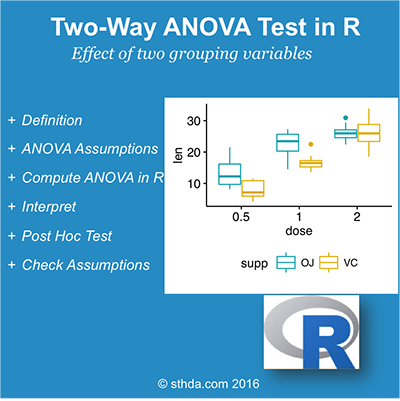
5.2 Two-Way ANOVA test
- What is two-way ANOVA test?
- Two-way ANOVA test hypotheses
- Assumptions of two-way ANOVA test
- Compute two-way ANOVA test in R: balanced designs
- Visualize your data
- Compute two-way ANOVA test
- Interpret the results
- Compute some summary statistics
- Multiple pairwise-comparison between the means of groups
- Tukey multiple pairewise-comparisons
- Multiple comparisons using multcomp package
- Pairwise t-test
- Check ANOVA assumptions: test validity?
- Check the homogeneity of variance assumption
- Check the normality assumption
- Compute two-way ANOVA test in R for unbalanced designs
Read more: —> Two-Way ANOVA Test in R.
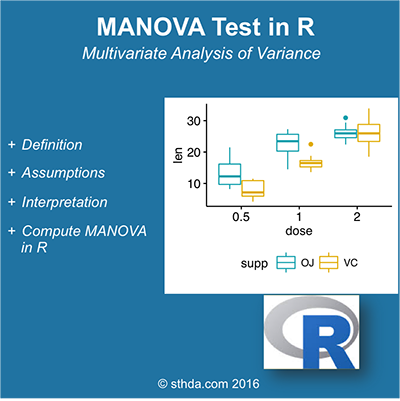
6 MANOVA test: Multivariate analysis of variance
- What is MANOVA test?
- Assumptions of MANOVA
- Interpretation of MANOVA
- Compute MANOVA in R
Read more: —> MANOVA Test in R: Multivariate Analysis of Variance.
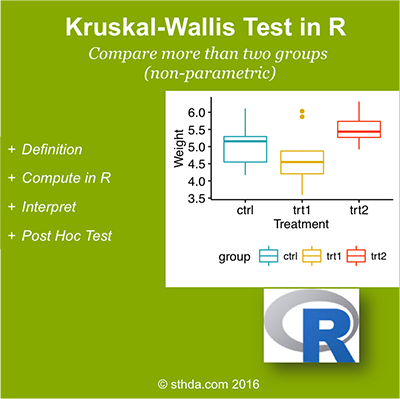
7 Kruskal-Wallis test
- What is Kruskal-Wallis test?
- Visualize your data and compute Kruskal-Wallis test in R
- Visualize the data using box plots
- Compute Kruskal-Wallis test
- Multiple pairwise-comparison between groups
Read more: —> Kruskal-Wallis Test in R (non parametric alternative to one-way ANOVA).
8 See also
9 Infos
This analysis has been performed using R statistical software (ver. 3.2.4).
Show me some love with the like buttons below... Thank you and please don't forget to share and comment below!!
Montrez-moi un peu d'amour avec les like ci-dessous ... Merci et n'oubliez pas, s'il vous plaît, de partager et de commenter ci-dessous!
Recommended for You!


Recommended for you
This section contains best data science and self-development resources to help you on your path.
Coursera - Online Courses and Specialization
Data science
- Course: Machine Learning: Master the Fundamentals by Standford
- Specialization: Data Science by Johns Hopkins University
- Specialization: Python for Everybody by University of Michigan
- Courses: Build Skills for a Top Job in any Industry by Coursera
- Specialization: Master Machine Learning Fundamentals by University of Washington
- Specialization: Statistics with R by Duke University
- Specialization: Software Development in R by Johns Hopkins University
- Specialization: Genomic Data Science by Johns Hopkins University
Popular Courses Launched in 2020
- Google IT Automation with Python by Google
- AI for Medicine by deeplearning.ai
- Epidemiology in Public Health Practice by Johns Hopkins University
- AWS Fundamentals by Amazon Web Services
Trending Courses
- The Science of Well-Being by Yale University
- Google IT Support Professional by Google
- Python for Everybody by University of Michigan
- IBM Data Science Professional Certificate by IBM
- Business Foundations by University of Pennsylvania
- Introduction to Psychology by Yale University
- Excel Skills for Business by Macquarie University
- Psychological First Aid by Johns Hopkins University
- Graphic Design by Cal Arts
Books - Data Science
Our Books
- Practical Guide to Cluster Analysis in R by A. Kassambara (Datanovia)
- Practical Guide To Principal Component Methods in R by A. Kassambara (Datanovia)
- Machine Learning Essentials: Practical Guide in R by A. Kassambara (Datanovia)
- R Graphics Essentials for Great Data Visualization by A. Kassambara (Datanovia)
- GGPlot2 Essentials for Great Data Visualization in R by A. Kassambara (Datanovia)
- Network Analysis and Visualization in R by A. Kassambara (Datanovia)
- Practical Statistics in R for Comparing Groups: Numerical Variables by A. Kassambara (Datanovia)
- Inter-Rater Reliability Essentials: Practical Guide in R by A. Kassambara (Datanovia)
Others
- R for Data Science: Import, Tidy, Transform, Visualize, and Model Data by Hadley Wickham & Garrett Grolemund
- Hands-On Machine Learning with Scikit-Learn, Keras, and TensorFlow: Concepts, Tools, and Techniques to Build Intelligent Systems by Aurelien Géron
- Practical Statistics for Data Scientists: 50 Essential Concepts by Peter Bruce & Andrew Bruce
- Hands-On Programming with R: Write Your Own Functions And Simulations by Garrett Grolemund & Hadley Wickham
- An Introduction to Statistical Learning: with Applications in R by Gareth James et al.
- Deep Learning with R by François Chollet & J.J. Allaire
- Deep Learning with Python by François Chollet
Click to follow us on Facebook and Google+ :
Comment this article by clicking on "Discussion" button (top-right position of this page)
Categories contained by this category :
t test
Articles contained by this category :
Kruskal-Wallis Test in R
MANOVA Test in R: Multivariate Analysis of Variance
One-Sample T-test in R
One-Sample Wilcoxon Signed Rank Test in R
One-Way ANOVA Test in R
Paired Samples T-test in R
Paired Samples Wilcoxon Test in R
t test formula
Two-Way ANOVA Test in R
Unpaired Two-Samples T-test in R
Unpaired Two-Samples Wilcoxon Test in R