


Tidyr: Crucial Step Reshaping Data with R for Easier Analyses
Previously, we described the essentials of R programming and provided quick start guides for importing data into R as well as converting your data into a tibble data format, which is the best and modern way to work with your data.

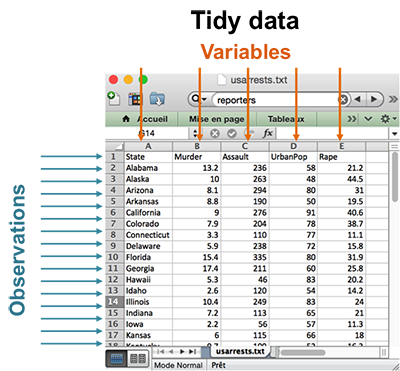
[Figure adapted from RStudio data wrangling cheatsheet (see reference section)]
What is a tidy data set?
A data set is called tidy when:
- each column represents a variable
- and each row represents an observation
The opposite of tidy is messy data, which corresponds to any other arrangement of the data.
Having your data in tidy format is crucial for facilitating the tasks of data analysis including data manipulation, modeling and visualization.
The R package tidyr, developed by Hadley Wickham, provides functions to help you organize (or reshape) your data set into tidy format. It’s particularly designed to work in combination with magrittr and dplyr to build a solid data analysis pipeline.
Preleminary tasks
Launch RStudio as described here: Running RStudio and setting up your working directory
Import your data as described here: Importing data into R
Reshaping data using tidyr package
The tidyr package, provides four functions to help you change the layout of your data set:
- gather(): gather (collapse) columns into rows
- spread(): spread rows into columns
- separate(): separate one column into multiple
- unite(): unite multiple columns into one
Installing and loading tidyr
# Installing
install.packages("tidyr")
# Loading
library("tidyr")
Example data sets
We’ll use the R built-in USArrests data sets. We start by subsetting a small data set, which will be used in the next sections as an example data set:
my_data <- USArrests[c(1, 10, 20, 30), ]
my_data
Murder Assault UrbanPop Rape
Alabama 13.2 236 58 21.2
Georgia 17.4 211 60 25.8
Maryland 11.3 300 67 27.8
New Jersey 7.4 159 89 18.8Row names are states, so let’s use the function cbind() to add a column named “state” in the data. This will make the data tidy and the analysis easier.
my_data <- cbind(state = rownames(my_data), my_data)
my_data
state Murder Assault UrbanPop Rape
Alabama Alabama 13.2 236 58 21.2
Georgia Georgia 17.4 211 60 25.8
Maryland Maryland 11.3 300 67 27.8
New Jersey New Jersey 7.4 159 89 18.8gather(): collapse columns into rows

- Simplified format:
gather(data, key, value, ...)- data: A data frame
- key, value: Names of key and value columns to create in output
- …: Specification of columns to gather. Allowed values are:
- variable names
- if you want to select all variables between a and e, use a:e
- if you want to exclude a column name y use -y
- for more options, see: dplyr::select()
- Examples of usage:
- Gather all columns except the column state
my_data2 <- gather(my_data,
                   key = "arrest_attribute",
                   value = "arrest_estimate",
                   -state)
my_data2
state arrest_attribute arrest_estimate
1 Alabama Murder 13.2
2 Georgia Murder 17.4
3 Maryland Murder 11.3
4 New Jersey Murder 7.4
5 Alabama Assault 236.0
6 Georgia Assault 211.0
7 Maryland Assault 300.0
8 New Jersey Assault 159.0
9 Alabama UrbanPop 58.0
10 Georgia UrbanPop 60.0
11 Maryland UrbanPop 67.0
12 New Jersey UrbanPop 89.0
13 Alabama Rape 21.2
14 Georgia Rape 25.8
15 Maryland Rape 27.8
16 New Jersey Rape 18.8Note that, all column names (except state) have been collapsed into a single key column (here “arrest_attribute”). Their values have been put into a value column (here “arrest_estimate”).
- Gather only Murder and Assault columns
my_data2 <- gather(my_data,
                   key = "arrest_attribute",
                   value = "arrest_estimate",
                   Murder, Assault)
my_data2
state UrbanPop Rape arrest_attribute arrest_estimate
1 Alabama 58 21.2 Murder 13.2
2 Georgia 60 25.8 Murder 17.4
3 Maryland 67 27.8 Murder 11.3
4 New Jersey 89 18.8 Murder 7.4
5 Alabama 58 21.2 Assault 236.0
6 Georgia 60 25.8 Assault 211.0
7 Maryland 67 27.8 Assault 300.0
8 New Jersey 89 18.8 Assault 159.0Note that, the two columns Murder and Assault have been collapsed and the remaining columns (state, UrbanPop and Rape) have been duplicated.
- Gather all variables between Murder and UrbanPop
my_data2 <- gather(my_data,
                   key = "arrest_attribute",
                   value = "arrest_estimate",
                   Murder:UrbanPop)
my_data2
state Rape arrest_attribute arrest_estimate
1 Alabama 21.2 Murder 13.2
2 Georgia 25.8 Murder 17.4
3 Maryland 27.8 Murder 11.3
4 New Jersey 18.8 Murder 7.4
5 Alabama 21.2 Assault 236.0
6 Georgia 25.8 Assault 211.0
7 Maryland 27.8 Assault 300.0
8 New Jersey 18.8 Assault 159.0
9 Alabama 21.2 UrbanPop 58.0
10 Georgia 25.8 UrbanPop 60.0
11 Maryland 27.8 UrbanPop 67.0
12 New Jersey 18.8 UrbanPop 89.0The remaining state column is duplicated.
- How to use gather() programmatically inside an R function?
You should use the function gather_() which takes character vectors, containing column names, instead of unquoted column names
The simplified syntax is as follow:
gather_(data, key_col, value_col, gather_cols)- data: a data frame
- key_col, value_col: Strings specifying the names of key and value columns to create
- gather_cols: Character vector specifying column names to be gathered together into pair of key-value columns.
As an example, type this:
gather_(my_data,
       key_col = "arrest_attribute",
       value_col = "arrest_estimate",
       gather_cols = c("Murder", "Assault"))
spread(): spread two columns into multiple columns

- Simplified format:
spread(data, key, value)- data: A data frame
- key: The (unquoted) name of the column whose values will be used as column headings.
- value:The (unquoted) names of the column whose values will populate the cells.
- Examples of usage:
Spread “my_data2” to turn back to the original data:
my_data3 <- spread(my_data2,
                   key = "arrest_attribute",
                   value = "arrest_estimate"
                   )
my_data3
state Rape Assault Murder UrbanPop
1 Alabama 21.2 236 13.2 58
2 Georgia 25.8 211 17.4 60
3 Maryland 27.8 300 11.3 67
4 New Jersey 18.8 159 7.4 89- How to use spread() programmatically inside an R function?
You should use the function spread_() which takes strings specifying key and value columns instead of unquoted column names
The simplified syntax is as follow:
spread_(data, key_col, value_col)- data: a data frame.
- key_col, value_col: Strings specifying the names of key and value columns.
As an example, type this:
spread_(my_data2,
       key = "arrest_attribute",
       value = "arrest_estimate"
       )
unite(): Unite multiple columns into one

- Simplified format:
unite(data, col, ..., sep = "_")- data: A data frame
- col: The new (unquoted) name of column to add.
- sep: Separator to use between values
- Examples of usage:
The R code below uses the data set “my_data” and unites the columns Murder and Assault
my_data4 <- unite(my_data,
                  col = "Murder_Assault",
                  Murder, Assault,
                  sep = "_")
my_data4
state Murder_Assault UrbanPop Rape
Alabama Alabama 13.2_236 58 21.2
Georgia Georgia 17.4_211 60 25.8
Maryland Maryland 11.3_300 67 27.8
New Jersey New Jersey 7.4_159 89 18.8- How to use unite() programmatically inside an R function?
You should use the function unite_() as follow.
unite_(data, col, from, sep = "_")- data: A data frame.
- col: String giving the name of the new column to be added
- from: Character vector specifying the names of existing columns to be united
- sep: Separator to use between values.
As an example, type this:
unite_(my_data,
    col = "Murder_Assault",
    from = c("Murder", "Assault"),
    sep = "_")
separate(): separate one column into multiple

- Simplified format:
separate(data, col, into, sep = "[^[:alnum:]]+")- data: A data frame
- col: Unquoted column names
- into: Character vector specifying the names of new variables to be created.
- sep: Separator between columns:
- If character, is interpreted as a regular expression.
- If numeric, interpreted as positions to split at. Positive values start at 1 at the far-left of the string; negative value start at -1 at the far-right of the string.
- Examples of usage:
Separate the column “Murder_Assault” [in my_data4] into two columns Murder and Assault:
separate(my_data4,
         col = "Murder_Assault",
         into = c("Murder", "Assault"),
         sep = "_")
state Murder Assault UrbanPop Rape
Alabama Alabama 13.2 236 58 21.2
Georgia Georgia 17.4 211 60 25.8
Maryland Maryland 11.3 300 67 27.8
New Jersey New Jersey 7.4 159 89 18.8- How to use separate() programmatically inside an R function?
You should use the function separate_() as follow.
separate_(data, col, into, sep = "[^[:alnum:]]+")- data: A data frame.
- col: String giving the name of the column to split
- into: Character vector specifying the names of new columns to create
- sep: Separator between columns (as above).
As an example, type this:
separate_(my_data4,
         col = "Murder_Assault",
         into = c("Murder", "Assault"),
         sep = "_")
Chaining multiple operations
It’s possible to combine multiple operations using maggrittr forward-pipe operator : %>%.
For example, x %>% f is equivalent to f(x).
In the following R code:
- first, my_data is passed to gather() function
- next, the output of gather() is passed to unite() function
my_data %>% gather(key = "arrest_attribute",
                   value = "arrest_estimate",
                   Murder:UrbanPop) %>%
            unite(col = "attribute_estimate",
                  arrest_attribute, arrest_estimate)
state Rape attribute_estimate
1 Alabama 21.2 Murder_13.2
2 Georgia 25.8 Murder_17.4
3 Maryland 27.8 Murder_11.3
4 New Jersey 18.8 Murder_7.4
5 Alabama 21.2 Assault_236
6 Georgia 25.8 Assault_211
7 Maryland 27.8 Assault_300
8 New Jersey 18.8 Assault_159
9 Alabama 21.2 UrbanPop_58
10 Georgia 25.8 UrbanPop_60
11 Maryland 27.8 UrbanPop_67
12 New Jersey 18.8 UrbanPop_89Summary
You should tidy your data for easier data analysis using the R package tidyr, which provides the following functions.
Collapse multiple columns together into key-value pairs (long data format): gather(data, key, value, …)
Spread key-value pairs into multiple columns (wide data format): spread(data, key, value)
Unite multiple columns into one: unite(data, col, …)
- Separate one columns into multiple: separate(data, col, into)
References
- The figures illustrating tidyr functions have been adapted from RStudio data wrangling cheatsheet
- Learn more about tidy data: Hadley Wickham. Tidy Data. Journal of Statistical Software, August 2014, Volume 59, Issue 10..
Infos
This analysis has been performed using R (ver. 3.2.3).
Show me some love with the like buttons below... Thank you and please don't forget to share and comment below!!
Montrez-moi un peu d'amour avec les like ci-dessous ... Merci et n'oubliez pas, s'il vous plaît, de partager et de commenter ci-dessous!
Recommended for You!


Recommended for you
This section contains best data science and self-development resources to help you on your path.
Coursera - Online Courses and Specialization
Data science
- Course: Machine Learning: Master the Fundamentals by Standford
- Specialization: Data Science by Johns Hopkins University
- Specialization: Python for Everybody by University of Michigan
- Courses: Build Skills for a Top Job in any Industry by Coursera
- Specialization: Master Machine Learning Fundamentals by University of Washington
- Specialization: Statistics with R by Duke University
- Specialization: Software Development in R by Johns Hopkins University
- Specialization: Genomic Data Science by Johns Hopkins University
Popular Courses Launched in 2020
- Google IT Automation with Python by Google
- AI for Medicine by deeplearning.ai
- Epidemiology in Public Health Practice by Johns Hopkins University
- AWS Fundamentals by Amazon Web Services
Trending Courses
- The Science of Well-Being by Yale University
- Google IT Support Professional by Google
- Python for Everybody by University of Michigan
- IBM Data Science Professional Certificate by IBM
- Business Foundations by University of Pennsylvania
- Introduction to Psychology by Yale University
- Excel Skills for Business by Macquarie University
- Psychological First Aid by Johns Hopkins University
- Graphic Design by Cal Arts
Books - Data Science
Our Books
- Practical Guide to Cluster Analysis in R by A. Kassambara (Datanovia)
- Practical Guide To Principal Component Methods in R by A. Kassambara (Datanovia)
- Machine Learning Essentials: Practical Guide in R by A. Kassambara (Datanovia)
- R Graphics Essentials for Great Data Visualization by A. Kassambara (Datanovia)
- GGPlot2 Essentials for Great Data Visualization in R by A. Kassambara (Datanovia)
- Network Analysis and Visualization in R by A. Kassambara (Datanovia)
- Practical Statistics in R for Comparing Groups: Numerical Variables by A. Kassambara (Datanovia)
- Inter-Rater Reliability Essentials: Practical Guide in R by A. Kassambara (Datanovia)
Others
- R for Data Science: Import, Tidy, Transform, Visualize, and Model Data by Hadley Wickham & Garrett Grolemund
- Hands-On Machine Learning with Scikit-Learn, Keras, and TensorFlow: Concepts, Tools, and Techniques to Build Intelligent Systems by Aurelien Géron
- Practical Statistics for Data Scientists: 50 Essential Concepts by Peter Bruce & Andrew Bruce
- Hands-On Programming with R: Write Your Own Functions And Simulations by Garrett Grolemund & Hadley Wickham
- An Introduction to Statistical Learning: with Applications in R by Gareth James et al.
- Deep Learning with R by François Chollet & J.J. Allaire
- Deep Learning with Python by François Chollet