


Tibble Data Format in R: Best and Modern Way to Work with Your Data
Previously, we described the essentials of R programming and provided quick start guides for importing data into R. The traditional R base functions read.table(), read.delim() and read.csv() import data into R as a data frame. However, the most modern R package readr provides several functions (read_delim(), read_tsv() and read_csv()), which are faster than R base functions and import data into R as a tbl_df (pronounced as “tibble diff”).
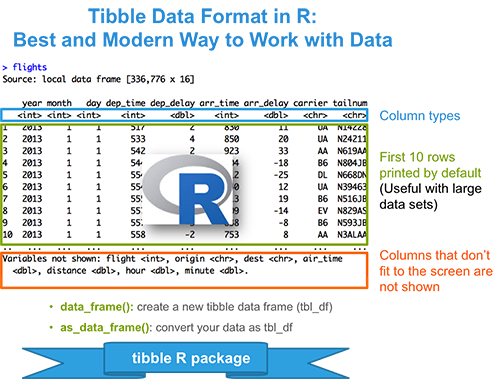
tbl_df object is a data frame providing a nicer printing method, useful when working with large data sets.
Preleminary tasks
Launch RStudio as described here: Running RStudio and setting up your working directory
Installing and loading tibble package
# Installing
install.packages("tibble")
# Loading
library("tibble")
Create a new tibble
To create a new tibble from combining multiple vectors, use the function data_frame():
# Create
friends_data <- data_frame(
  name = c("Nicolas", "Thierry", "Bernard", "Jerome"),
  age = c(27, 25, 29, 26),
  height = c(180, 170, 185, 169),
  married = c(TRUE, FALSE, TRUE, TRUE)
)
# Print
friends_data
Source: local data frame [4 x 4]
name age height married
1 Nicolas 27 180 TRUE
2 Thierry 25 170 FALSE
3 Bernard 29 185 TRUE
4 Jerome 26 169 TRUE Compared to the traditional data.frame(), the modern data_frame():
- never converts string as factor
- never changes the names of variables
- never create row names
Convert your data as a tibble
Note that, if you use the readr package to import your data into R, then you don’t need to do this step. readr imports already data as tbl_df.
To convert a traditional data as a tibble use the function as_data_frame() [in tibble package], which works on data frames, lists, matrices and tables:
library("tibble")
# Loading data
data("iris")
# Class of iris
class(iris)
[1] "data.frame"# Print the frist 6 rows
head(iris, 6) Sepal.Length Sepal.Width Petal.Length Petal.Width Species
1 5.1 3.5 1.4 0.2 setosa
2 4.9 3.0 1.4 0.2 setosa
3 4.7 3.2 1.3 0.2 setosa
4 4.6 3.1 1.5 0.2 setosa
5 5.0 3.6 1.4 0.2 setosa
6 5.4 3.9 1.7 0.4 setosa# Convert iris data to a tibble
my_data <- as_data_frame(iris)
class(my_data)[1] "tbl_df" "tbl" "data.frame"# Print my data
my_dataSource: local data frame [150 x 5]
  Sepal.Length Sepal.Width Petal.Length Petal.Width Species
1          5.1         3.5          1.4         0.2  setosa
2          4.9         3.0          1.4         0.2  setosa
3          4.7         3.2          1.3         0.2  setosa
4          4.6         3.1          1.5         0.2  setosa
5          5.0         3.6          1.4         0.2  setosa
6          5.4         3.9          1.7         0.4  setosa
7 4.6 3.4 1.4 0.3 setosa
8 5.0 3.4 1.5 0.2 setosa
9 4.4 2.9 1.4 0.2 setosa
10 4.9 3.1 1.5 0.1 setosa
.. ... ... ... ... ... Note that, only the first 10 rows are displayed
In the situation where you want to turn a tibble back to a data frame, use the function as.data.frame(my_data).
Advantages of tibbles compared to data frames
Tibbles have nice printing method that show only the first 10 rows and all the columns that fit on the screen. This is useful when you work with large data sets.
- When printed, the data type of each column is specified (see below):
: for double : for factor : for character : for logical
my_dataSource: local data frame [150 x 5]
Sepal.Length Sepal.Width Petal.Length Petal.Width Species
1 5.1 3.5 1.4 0.2 setosa
2 4.9 3.0 1.4 0.2 setosa
3 4.7 3.2 1.3 0.2 setosa
4 4.6 3.1 1.5 0.2 setosa
5 5.0 3.6 1.4 0.2 setosa
6 5.4 3.9 1.7 0.4 setosa
7 4.6 3.4 1.4 0.3 setosa
8 5.0 3.4 1.5 0.2 setosa
9 4.4 2.9 1.4 0.2 setosa
10 4.9 3.1 1.5 0.1 setosa
.. ... ... ... ... ... It’s possible to change the default printing appearance as follow:
- Change the maximum and the minimum rows to print: options(tibble.print_max = 20, tibble.print_min = 6)
- Always show all rows: options(tibble.print_max = Inf)
- Always show all columns: options(tibble.width = Inf)
- Subsetting a tibble will always return a tibble. You don’t need to use drop = FALSE compared to traditional data.frames.
Summary
Create a tibble: data_frame()
Convert your data to a tibble: as_data_frame()
- Change default printing appearance of a tibble: options(tibble.print_max = 20, tibble.print_min = 6)
Infos
This analysis has been performed using R (ver. 3.2.3).
Show me some love with the like buttons below... Thank you and please don't forget to share and comment below!!
Montrez-moi un peu d'amour avec les like ci-dessous ... Merci et n'oubliez pas, s'il vous plaît, de partager et de commenter ci-dessous!
Recommended for You!


Recommended for you
This section contains best data science and self-development resources to help you on your path.
Coursera - Online Courses and Specialization
Data science
- Course: Machine Learning: Master the Fundamentals by Standford
- Specialization: Data Science by Johns Hopkins University
- Specialization: Python for Everybody by University of Michigan
- Courses: Build Skills for a Top Job in any Industry by Coursera
- Specialization: Master Machine Learning Fundamentals by University of Washington
- Specialization: Statistics with R by Duke University
- Specialization: Software Development in R by Johns Hopkins University
- Specialization: Genomic Data Science by Johns Hopkins University
Popular Courses Launched in 2020
- Google IT Automation with Python by Google
- AI for Medicine by deeplearning.ai
- Epidemiology in Public Health Practice by Johns Hopkins University
- AWS Fundamentals by Amazon Web Services
Trending Courses
- The Science of Well-Being by Yale University
- Google IT Support Professional by Google
- Python for Everybody by University of Michigan
- IBM Data Science Professional Certificate by IBM
- Business Foundations by University of Pennsylvania
- Introduction to Psychology by Yale University
- Excel Skills for Business by Macquarie University
- Psychological First Aid by Johns Hopkins University
- Graphic Design by Cal Arts
Books - Data Science
Our Books
- Practical Guide to Cluster Analysis in R by A. Kassambara (Datanovia)
- Practical Guide To Principal Component Methods in R by A. Kassambara (Datanovia)
- Machine Learning Essentials: Practical Guide in R by A. Kassambara (Datanovia)
- R Graphics Essentials for Great Data Visualization by A. Kassambara (Datanovia)
- GGPlot2 Essentials for Great Data Visualization in R by A. Kassambara (Datanovia)
- Network Analysis and Visualization in R by A. Kassambara (Datanovia)
- Practical Statistics in R for Comparing Groups: Numerical Variables by A. Kassambara (Datanovia)
- Inter-Rater Reliability Essentials: Practical Guide in R by A. Kassambara (Datanovia)
Others
- R for Data Science: Import, Tidy, Transform, Visualize, and Model Data by Hadley Wickham & Garrett Grolemund
- Hands-On Machine Learning with Scikit-Learn, Keras, and TensorFlow: Concepts, Tools, and Techniques to Build Intelligent Systems by Aurelien Géron
- Practical Statistics for Data Scientists: 50 Essential Concepts by Peter Bruce & Andrew Bruce
- Hands-On Programming with R: Write Your Own Functions And Simulations by Garrett Grolemund & Hadley Wickham
- An Introduction to Statistical Learning: with Applications in R by Gareth James et al.
- Deep Learning with R by François Chollet & J.J. Allaire
- Deep Learning with Python by François Chollet