


IGV - Integrative Genomics Viewer
This analysis was performed using R (ver. 3.1.0).Load packages and data
We’re going to use the RNA sequencing experiment in the passilaBamSubset package.
#biocLite("pasillaBamSubset")
#biocLite("TxDb.Dmelanogaster.UCSC.dm3.ensGene")
library(pasillaBamSubset)
#Genes annotated in transcript database
library(TxDb.Dmelanogaster.UCSC.dm3.ensGene)
#The 2 files of interest
fl1 <- untreated1_chr4()
fl2 <- untreated3_chr4()
IGV - Integrative Genomics Viewer
IGV is freely available for download here.
Copy fl1 and fl2 from the R library directory to the current working directory.
We need to use the `Rsamtools` library to index the BAM files for using IGV.file.copy(from=fl1,to=basename(fl1))## [1] FALSEfile.copy(from=fl2,to=basename(fl2))## [1] FALSElibrary(Rsamtools)
indexBam(basename(fl1))## untreated1_chr4.bam
## "untreated1_chr4.bam.bai"indexBam(basename(fl2))## untreated3_chr4.bam
## "untreated3_chr4.bam.bai"Note that if you have trouble downloading IGV, another option for visualization is the UCSC Genome Browser: http://genome.ucsc.edu/cgi-bin/hgTracks
The UCSC Genome Browser is a great resource, having many tracks involving gene annotations, conservation over multiple species, and the ENCODE epigentic tracks is already available. However, the UCSC Genome Browser requires that you upload your genomic files to their server, or put your data on a publicly available server. This is not always possible if you are working with confidential data.Using IGV, look the gene lgs.
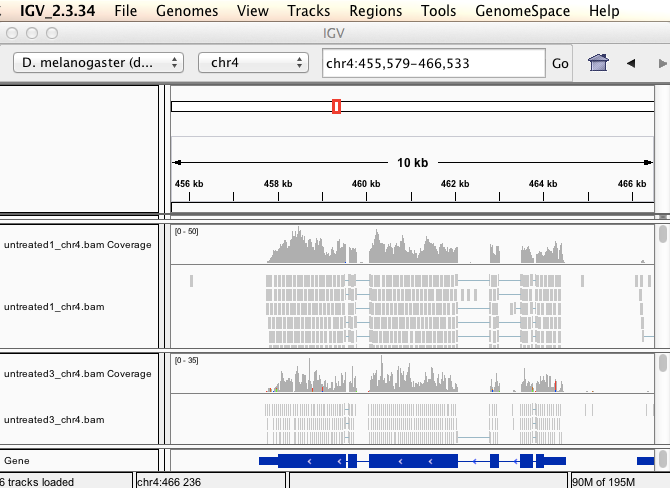
In this example the data is an RNA sequencing experiment of Drosophila. From IGV, we need to use the Drosophila melanogaster genome, and specifically the dm3 genome.
Load the 2 bam files: File -> load from file -> select the 2 bam files. Two new tracks are created (one track for each file).
The passilaBamSubset package is a subset of the reads, which map to chromosome 4. Select chromosome 4, type the gene name lgs in the search field, and click Go. We can see that the coverage only is on the exons, mostly.
And if we zoom in (hold Shift, and drag on the top part to zoom) you can see the individual reads. There are reads on the plus strand and minus strand. IGV is a very useful program for visualizing quickly reads from sequencing experiments.
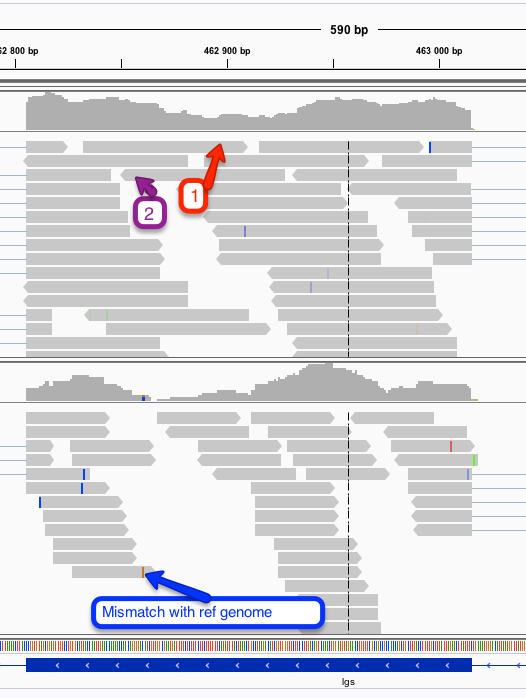
Legend: 1 = Reads on the plus strand 2 = Reads on the minus strand 3 = Mismatch base compared to the reference genome
Video : Visualizing NGS data with IGV
(French)
In the next unit, I'm going to show how to generate coverage plots-- like the ones in here-- but within Bioconductor.Footnotes
UCSC Genome Browser: zooms and scrolls over chromosomes, showing the work of annotators worldwide http://genome.ucsc.edu/
Licence
References
Show me some love with the like buttons below... Thank you and please don't forget to share and comment below!!
Montrez-moi un peu d'amour avec les like ci-dessous ... Merci et n'oubliez pas, s'il vous plaît, de partager et de commenter ci-dessous!
Recommended for You!


Recommended for you
This section contains best data science and self-development resources to help you on your path.
Coursera - Online Courses and Specialization
Data science
- Course: Machine Learning: Master the Fundamentals by Standford
- Specialization: Data Science by Johns Hopkins University
- Specialization: Python for Everybody by University of Michigan
- Courses: Build Skills for a Top Job in any Industry by Coursera
- Specialization: Master Machine Learning Fundamentals by University of Washington
- Specialization: Statistics with R by Duke University
- Specialization: Software Development in R by Johns Hopkins University
- Specialization: Genomic Data Science by Johns Hopkins University
Popular Courses Launched in 2020
- Google IT Automation with Python by Google
- AI for Medicine by deeplearning.ai
- Epidemiology in Public Health Practice by Johns Hopkins University
- AWS Fundamentals by Amazon Web Services
Trending Courses
- The Science of Well-Being by Yale University
- Google IT Support Professional by Google
- Python for Everybody by University of Michigan
- IBM Data Science Professional Certificate by IBM
- Business Foundations by University of Pennsylvania
- Introduction to Psychology by Yale University
- Excel Skills for Business by Macquarie University
- Psychological First Aid by Johns Hopkins University
- Graphic Design by Cal Arts
Books - Data Science
Our Books
- Practical Guide to Cluster Analysis in R by A. Kassambara (Datanovia)
- Practical Guide To Principal Component Methods in R by A. Kassambara (Datanovia)
- Machine Learning Essentials: Practical Guide in R by A. Kassambara (Datanovia)
- R Graphics Essentials for Great Data Visualization by A. Kassambara (Datanovia)
- GGPlot2 Essentials for Great Data Visualization in R by A. Kassambara (Datanovia)
- Network Analysis and Visualization in R by A. Kassambara (Datanovia)
- Practical Statistics in R for Comparing Groups: Numerical Variables by A. Kassambara (Datanovia)
- Inter-Rater Reliability Essentials: Practical Guide in R by A. Kassambara (Datanovia)
Others
- R for Data Science: Import, Tidy, Transform, Visualize, and Model Data by Hadley Wickham & Garrett Grolemund
- Hands-On Machine Learning with Scikit-Learn, Keras, and TensorFlow: Concepts, Tools, and Techniques to Build Intelligent Systems by Aurelien Géron
- Practical Statistics for Data Scientists: 50 Essential Concepts by Peter Bruce & Andrew Bruce
- Hands-On Programming with R: Write Your Own Functions And Simulations by Garrett Grolemund & Hadley Wickham
- An Introduction to Statistical Learning: with Applications in R by Gareth James et al.
- Deep Learning with R by François Chollet & J.J. Allaire
- Deep Learning with Python by François Chollet