


Required R Packages for Principal Component Methods
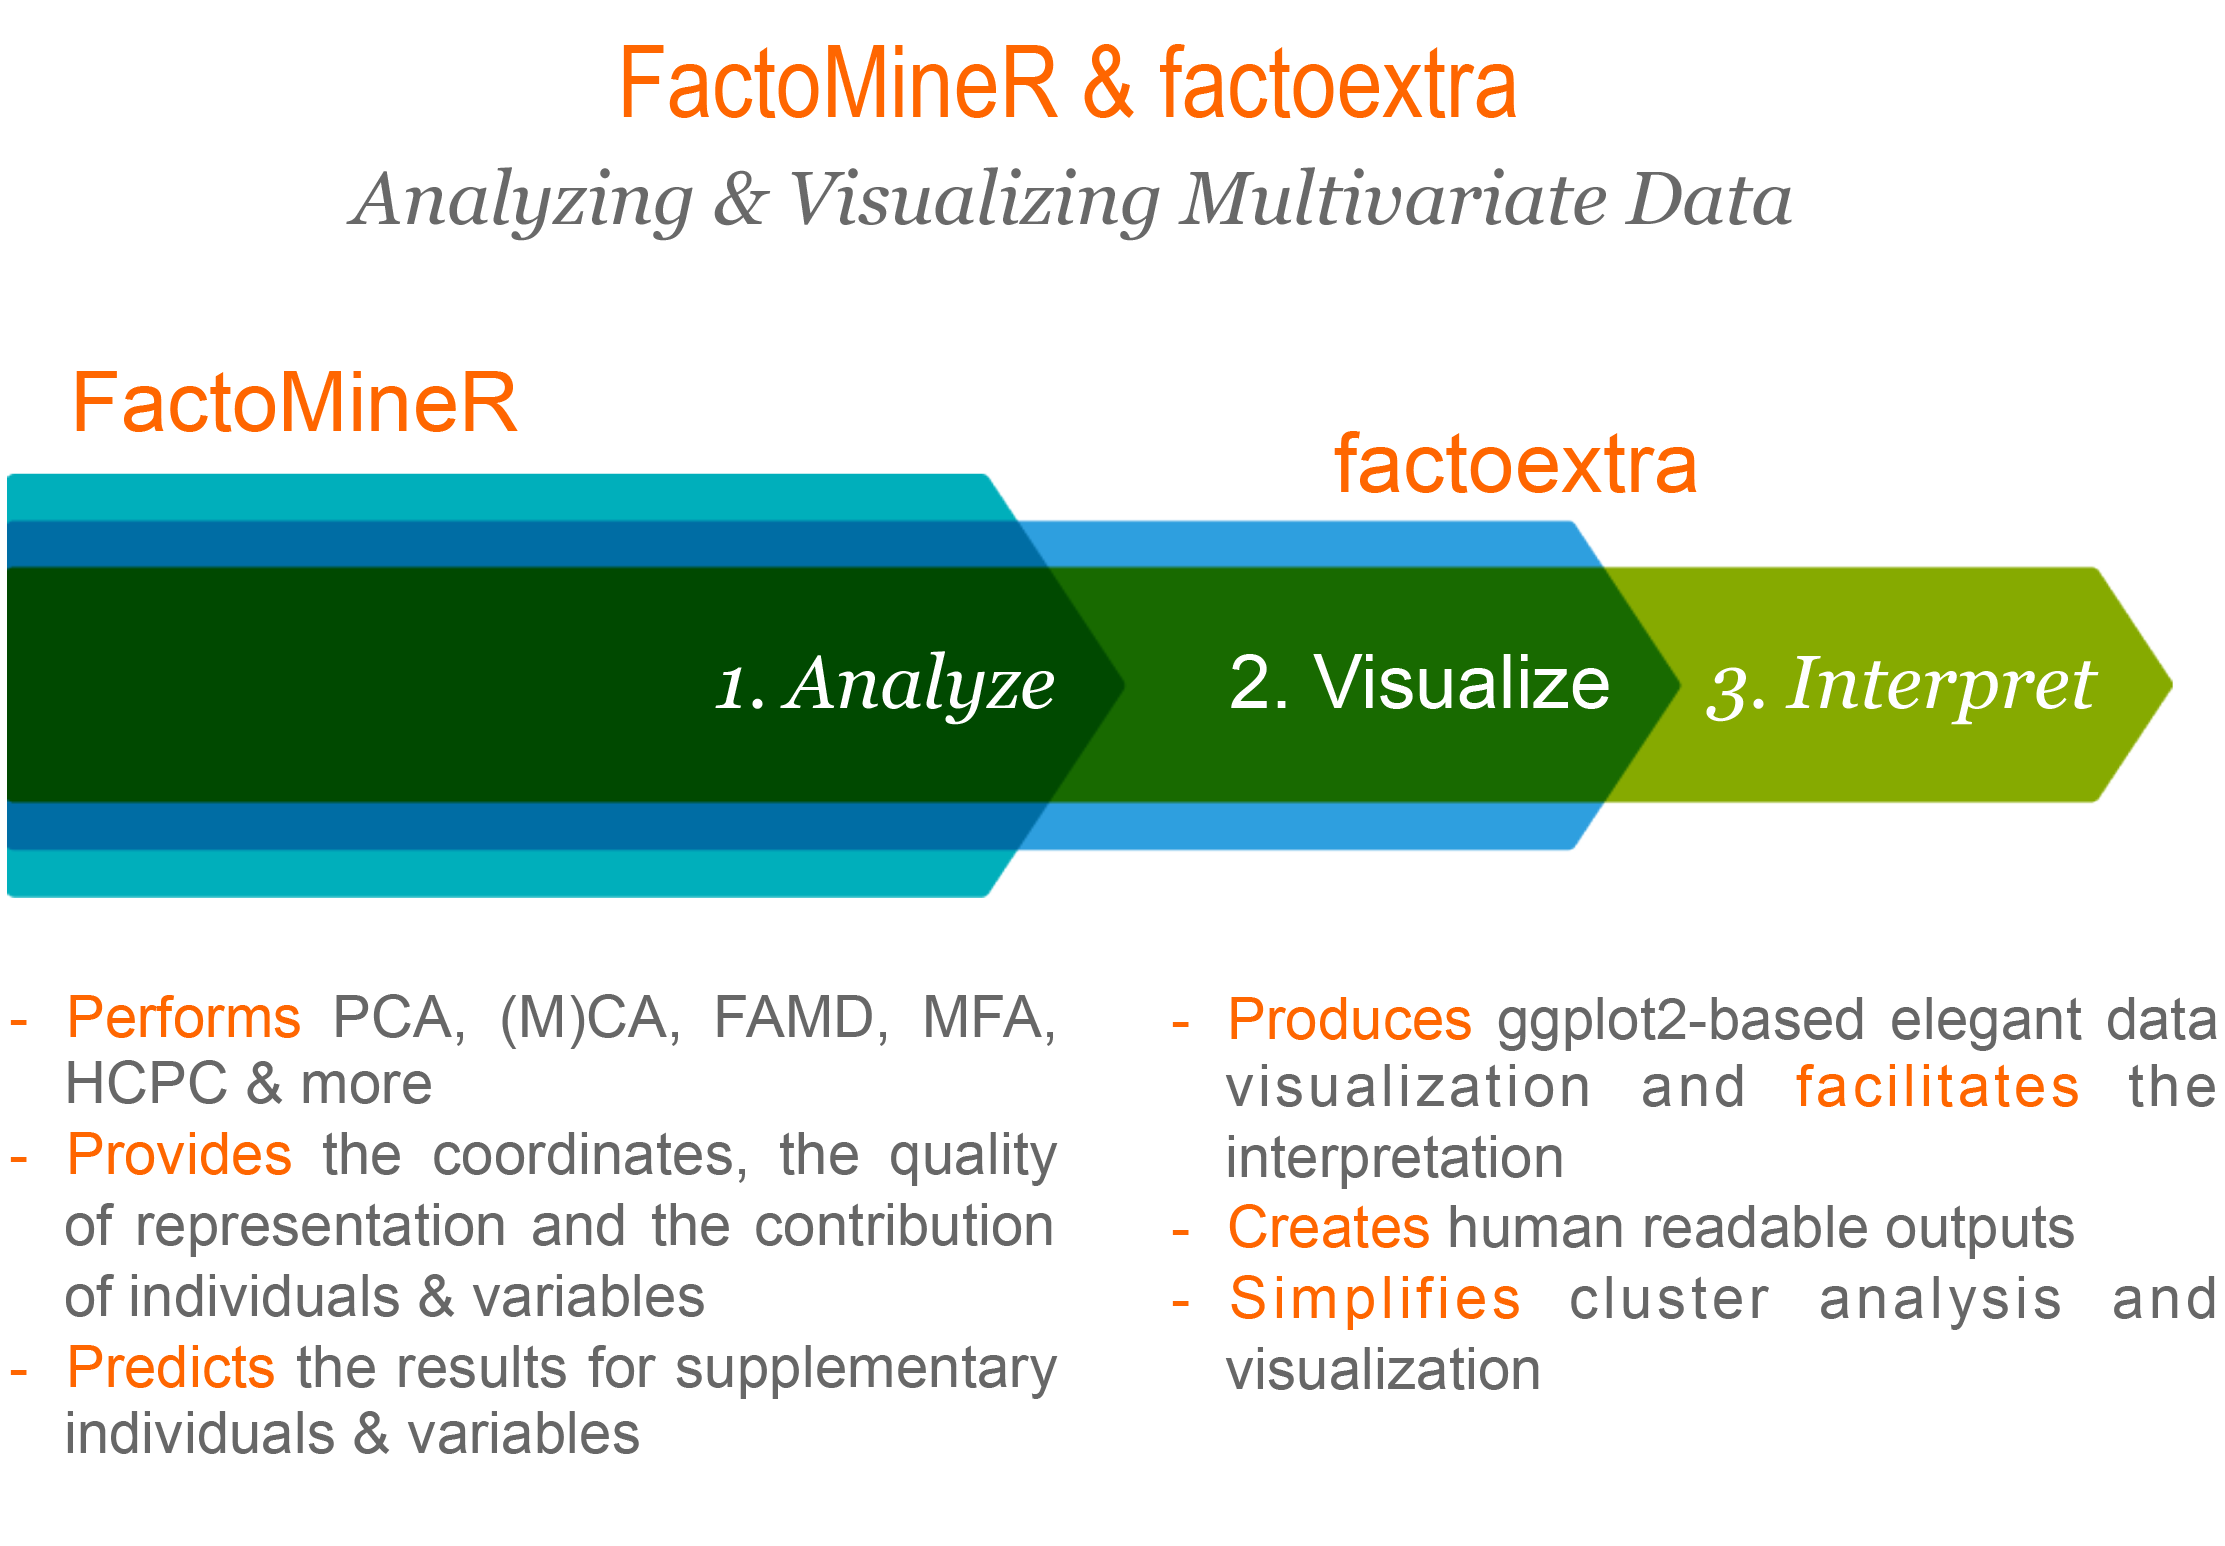
FactoMineR & factoextra
There are a number of R packages implementing principal component methods. These packages include: FactoMineR, ade4, stats, ca, MASS and ExPosition.
However, the result is presented differently depending on the used package.
To help in the interpretation and in the visualization of multivariate analysis - such as cluster analysis and principal component methods - we developed an easy-to-use R package named factoextra (official online documentation: http://www.sthda.com/english/rpkgs/factoextra)(Kassambara and Mundt 2017).
No matter which package you decide to use for computing principal component methods, the factoextra R package can help to extract easily, in a human readable data format, the analysis results from the different packages mentioned above. factoextra provides also convenient solutions to create ggplot2-based beautiful graphs.
In this book, we’ll use mainly:
- the FactoMineR package (Husson et al. 2017) to compute principal component methods;
- and the factoextra package (Kassambara and Mundt 2017) for extracting, visualizing and interpreting the results.
The other packages - ade4, ExPosition, etc - will be presented briefly.
The Figure 2.1 illustrates the key functionality of FactoMineR and factoextra.
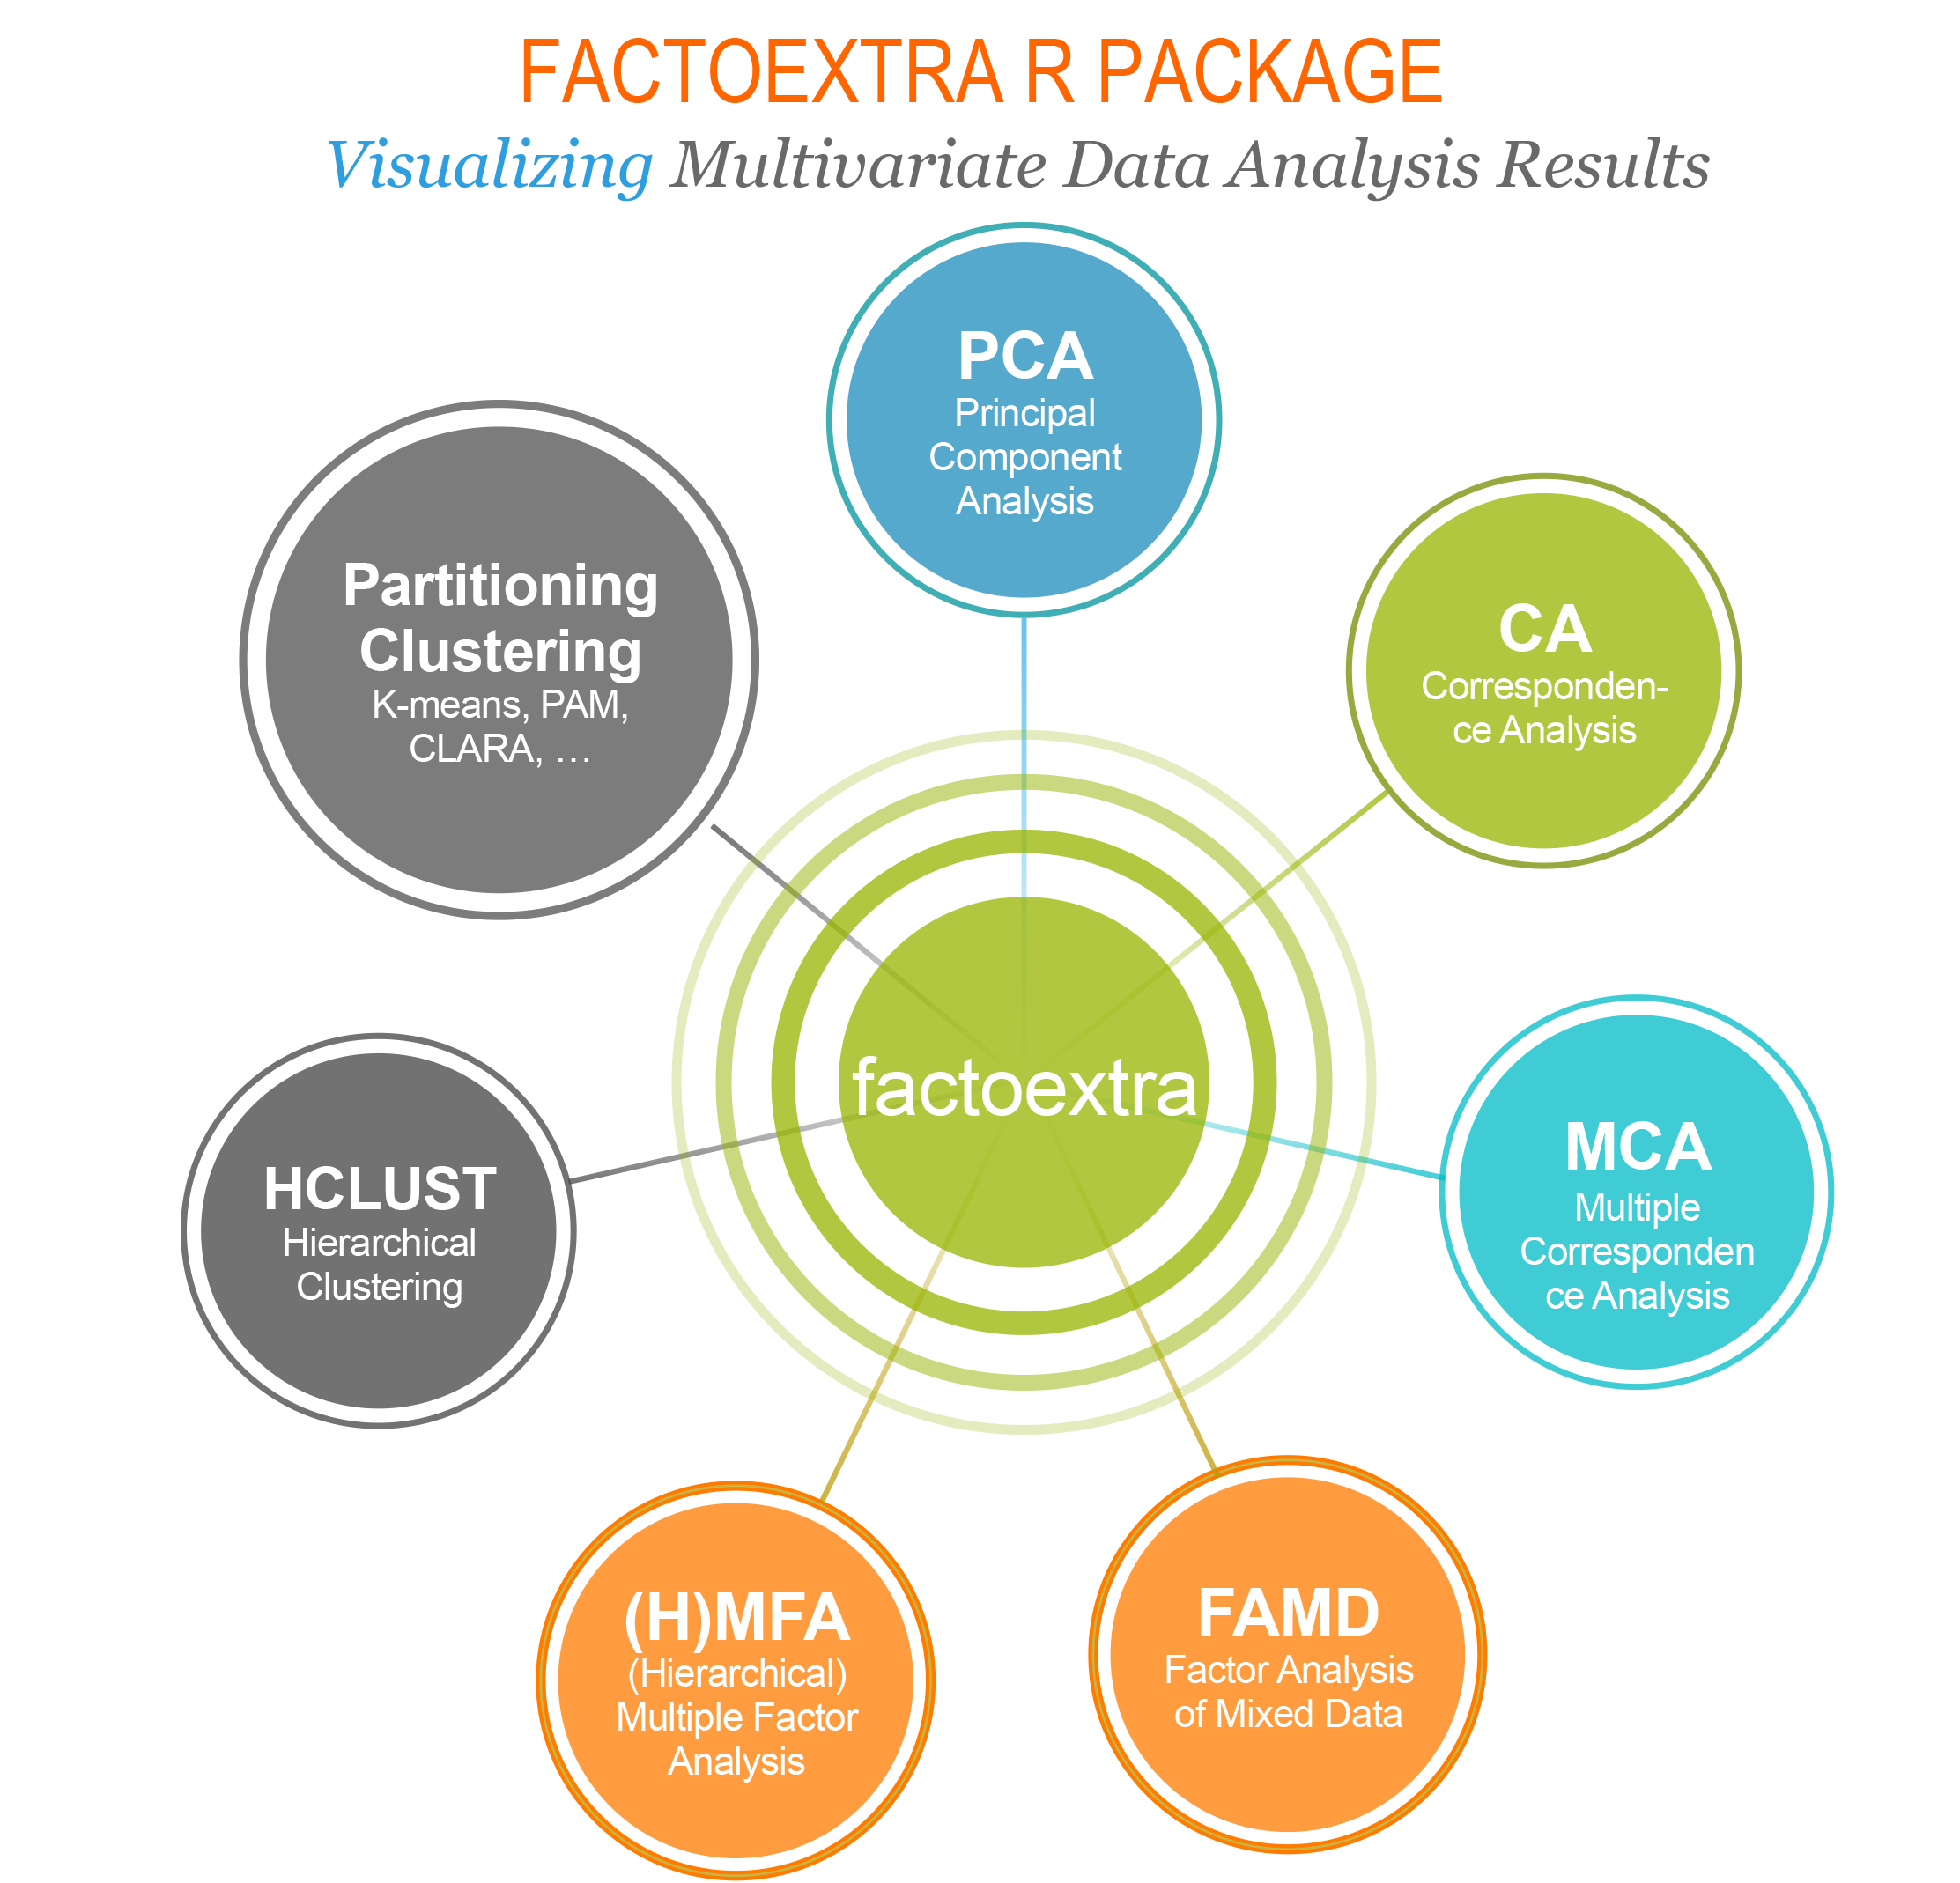
Methods, which outputs can be visualized using the factoextra package are shown on the Figure 2.2:
Installation
Installing FactoMineR
The FactoMineR package can be installed and loaded as follow:
# Install
install.packages("FactoMineR")
# Load
library("FactoMineR")
Installing factoextra
- factoextra can be installed from CRAN as follow:
install.packages("factoextra")- Or, install the latest developmental version from Github
if(!require(devtools)) install.packages("devtools")
devtools::install_github("kassambara/factoextra")- Load factoextra as follow :
library("factoextra")Main R functions
Main functions in FactoMineR
Functions for computing principal component methods and clustering:
| Functions | Description |
|---|---|
PCA |
Principal component analysis. |
CA |
Correspondence analysis. |
MCA |
Multiple correspondence analysis. |
FAMD |
Factor analysis of mixed data. |
MFA |
Multiple factor analysis. |
HCPC |
Hierarchical clustering on principal components. |
dimdesc |
Dimension description. |
Main functions in factoextra
factoextra functions covered in this book are listed in the table below. See the online documentation (http://www.sthda.com/english/rpkgs/factoextra) for a complete list.
- Visualizing principal component method outputs
| Functions | Description |
|---|---|
fviz_eig (or fviz_eigenvalue) |
Visualize eigenvalues. |
fviz_pca |
Graph of PCA results. |
fviz_ca |
Graph of CA results. |
fviz_mca |
Graph of MCA results. |
fviz_mfa |
Graph of MFA results. |
fviz_famd |
Graph of FAMD results. |
fviz_hmfa |
Graph of HMFA results. |
fviz_ellipses |
Plot ellipses around groups. |
fviz_cos2 |
Visualize element cos2.1 |
fviz_contrib |
Visualize element contributions.2 |
- Extracting data from principal component method outputs. The following functions extract all the results (coordinates, squared cosine, contributions) for the active individuals/variables from the analysis outputs.
| Functions | Description |
|---|---|
get_eigenvalue |
Access to the dimension eigenvalues. |
get_pca |
Access to PCA outputs. |
get_ca |
Access to CA outputs. |
get_mca |
Access to MCA outputs. |
get_mfa |
Access to MFA outputs. |
get_famd |
Access to MFA outputs. |
get_hmfa |
Access to HMFA outputs. |
facto_summarize |
Summarize the analysis. |
- Clustering analysis and visualization
| Functions | Description |
|---|---|
fviz_dend |
Enhanced Visualization of Dendrogram. |
fviz_cluster |
Visualize Clustering Results. |
References
Husson, Francois, Julie Josse, Sebastien Le, and Jeremy Mazet. 2017. FactoMineR: Multivariate Exploratory Data Analysis and Data Mining. https://CRAN.R-project.org/package=FactoMineR.
Kassambara, Alboukadel, and Fabian Mundt. 2017. Factoextra: Extract and Visualize the Results of Multivariate Data Analyses. http://www.sthda.com/english/rpkgs/factoextra.