ggjoy: Create a ggplot2-based Joyplots
Joyplots consist of partially overlapping line plots for visualizing changes in distribution over time or space. Joyplots can be easily created in R using the ggjoy package, which is an extension of ggplot2.
Install ggjoy
install.packages("ggjoy")
Use ggjoy
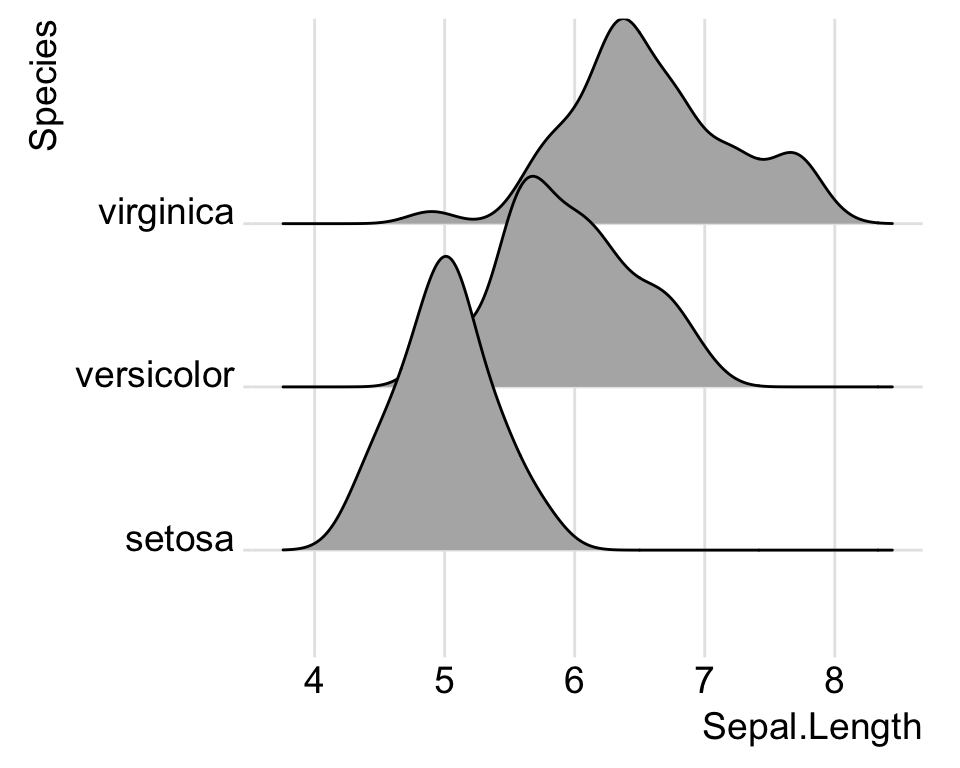
In the example below, we’ll use the iris demo data set. We’ll visualize the distribution of the variable Sepal.Length by groups (“Species”).
library(ggplot2)
library(ggjoy)
ggplot(iris, aes(x = Sepal.Length, y = Species)) +
  geom_joy() +
  theme_joy()
Control the overlap of the different density plots. Use the argument scale .
ggplot(iris, aes(x = Sepal.Length, y = Species)) +
  geom_joy(scale = 0.9) +
  theme_joy()
Enjoyed this article? Give us 5 stars
Avez vous aimé cet article? Donnez nous 5 étoiles
Recommended for You!
Recommended for you This section contains best data science and self-development resources to help you on your path.
Coursera - Online Courses and Specialization Data science Popular Courses Launched in 2020 Trending Courses Books - Data Science Our Books Others